
Arizona · Gilbert · Mesa · Chandler · East Valley
RGB crop progression and emergence counts for East Valley irrigated fields
Repeat, dated drone orthomosaics to watch emergence, canopy fill and irrigation-related anomalies — with visible-plant counts on sample zones where seedlings are resolvable. Service coverage subject to scheduling; no local Arizona office.
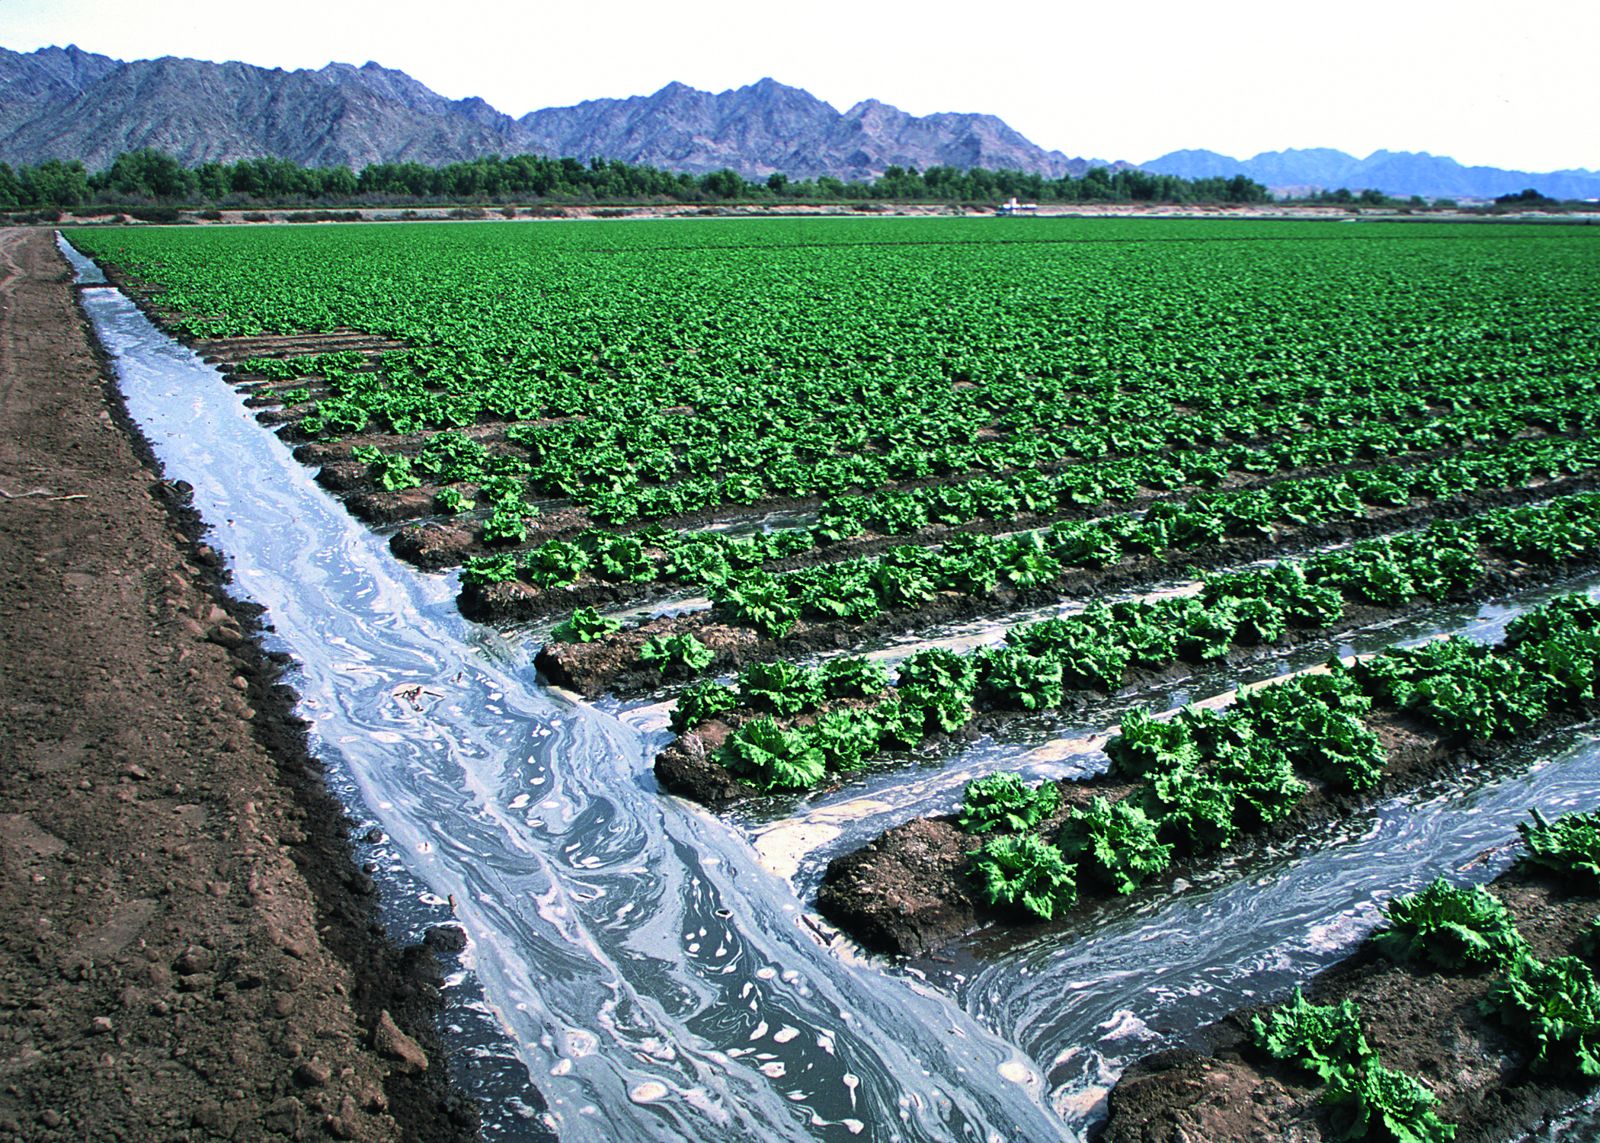
Irrigated lettuce field — Yuma, Arizona. Representative Arizona agriculture; not Athena client projects. USDA NRCS public-domain photo taken in Yuma, Arizona — not Gilbert, Mesa or Chandler, and not an Athena customer site.
01 — Overview
Built around irrigation, heat and short flight windows
Farm ground on the edges of the East Valley is mostly irrigated, and many of the patterns worth seeing from the air are irrigation-related: uneven water advance, dry corners, ponding at tail ends and emergence gaps along borders. Dated RGB maps make those visible changes easy to compare between visits.
Desert heat shapes the work. Summer flights are planned for early morning to protect batteries and reduce harsh shadows, and that also keeps lighting more consistent from visit to visit — which matters when you compare maps. Arizona projects are scheduled by request, so tell us your target dates early.
02 — Scope
Use cases and deliverables
Where it helps in the East Valley
- —A dated progression record of a field from pre-irrigation through canopy fill
- —Spotting visible irrigation-uniformity patterns worth checking on the ground
- —Emergence counts on sample zones of row crops where seedlings are resolvable
- —Documenting visible storm, dust or flood effects after a monsoon event
- —Before/after imagery for land being converted, leveled or taken out of production
Typical deliverables
- —Dated GeoTIFF orthomosaic per visit with logged GSD and time of day
- —Side-by-side comparison set and RGB cover-proxy summary by zone
- —Count table and overlay map for sample zones, when counts are in scope
- —Field-anomaly sketch map flagging areas worth scouting
- —Method & limitations note for every visit
Exact outputs depend on the project, overlap, site conditions and what is agreed in the written scope.
Arizona crops
Irrigated desert agriculture
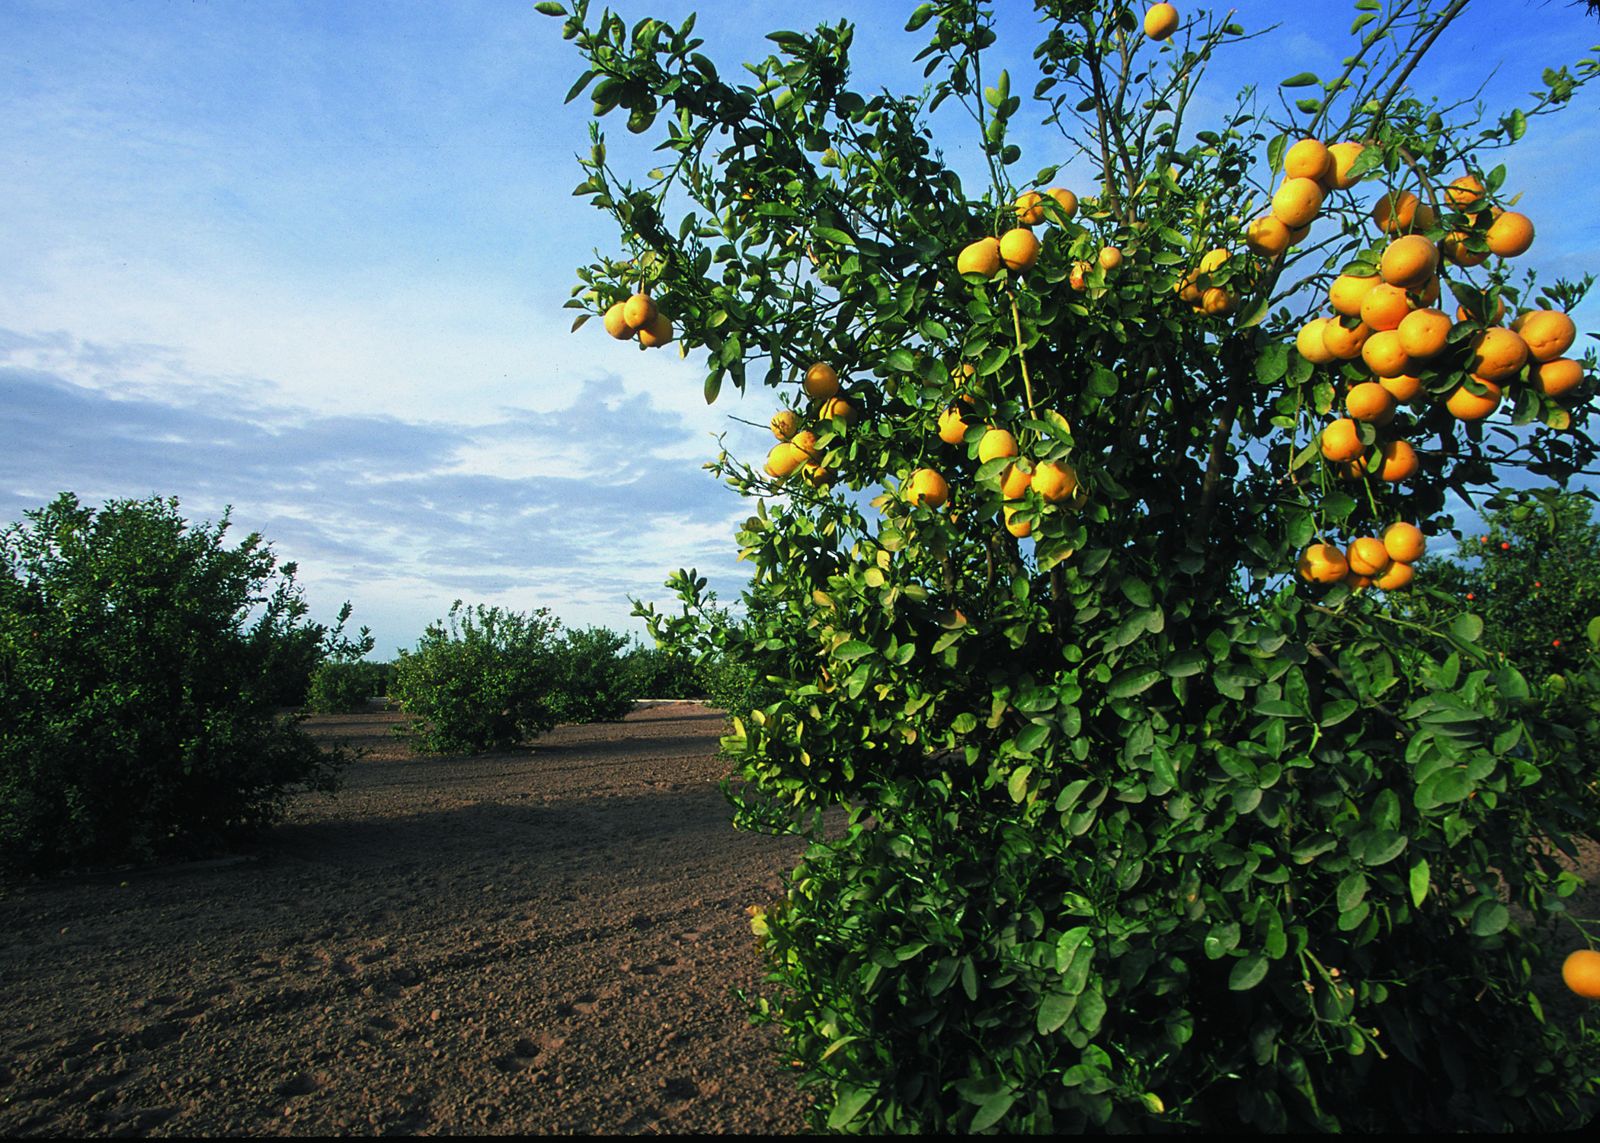
Representative Arizona agriculture; not Athena client projects. Photos: Jeff Vanuga / USDA NRCS (public domain); no USDA endorsement implied. Credits
Method
Stand / emergence counts: what is actually counted
We count plants visible in the imagery, not the true agronomic stand. A visible-plant count misses plants that are hidden, too small to resolve, or merged with neighbors, and it can mistake weeds or volunteers for crop. We report it as an estimate with its method and limits, so you can compare it with your own in-field counts.
- —Reported per sample area as plants per row length (e.g. per 1/1000 acre of row), plants per square foot, and estimated plants per acre, broken out by planting zone where boundaries are provided.
- —Gap and double heuristics: spacing between detected plants flagged as possible skips (long gaps) or possible doubles (very short spacing). These are screening flags for field checks, not a planter diagnosis.
- —Counts are only attempted where plants are resolvable: typically early emergence (for example corn around VE–V4) before leaves overlap between plants and rows. Once the canopy closes, individual counts are not defensible and we will say so.
- —Ground sampling distance (GSD) must be fine enough that one seedling covers several pixels. We plan altitude to target sub-centimeter-to-about-1 cm GSD on count areas, which means low flights and more time per acre. If the target GSD can't be reached safely, we won't sell a count.
- —Counting is done by a documented semi-automated or manual-review workflow on sample zones. We don't advertise fully automated, validated whole-field plant counts.
Method
Crop progression monitoring: comparing dated RGB maps
Progression monitoring repeats a planned flight on agreed dates and compares the resulting orthomosaics or fixed-viewpoint photos side by side. It shows visible changes: emergence, canopy fill-in, lodging, flooding or washout, hail or wind damage, weed patches and other field anomalies worth scouting.
- —Visible-color vegetation cover proxies (for example percent green canopy cover or an RGB greenness index such as ExG) computed from ordinary color imagery.
- —RGB indices are not NDVI and are not multispectral agronomy. They do not measure chlorophyll, nitrogen status, water stress or yield, and are sensitive to sun angle, shadows, soil color and camera exposure.
- —Comparability depends on consistent altitude, time of day and settings; we log these for every visit and flag dates where lighting or wind make comparisons weak.
- —Findings are observations to guide scouting. We don't issue treatment prescriptions, variable-rate application maps or agronomic recommendations.
What you provide
- —Crop species and hybrid/variety if known
- —Planting date(s) and target seeding rate
- —Row spacing and row direction
- —Acres and field boundaries (shapefile, KML or a marked map)
- —Count goal and sampling plan: which zones, how many samples, or let us propose one
- —Georeference needs: is standard drone GPS fine, or do you need ground control or RTK-checked positions?
- —Ground truth: in-field hand counts on a few marked sample rows, if you want the estimate checked
- —Target repeat visits and dates (for progression)
- —Launch access, field contact and any irrigation, livestock or equipment schedule
Sample deliverable specification
- —Georeferenced RGB orthomosaic (GeoTIFF) per visit, with stated GSD
- —Count table (CSV) by sample zone: visible plants, row length or area, plants/acre estimate, gap/double flags
- —Count overlay map (PDF/PNG) and optional point layer (GeoJSON/shapefile) where geolocation supports it
- —Progression: dated side-by-side map set and an RGB cover-proxy summary per zone
- —Method & limitations note: flight date/time, altitude, GSD, lighting, growth stage, and known error sources
Exact outputs are fixed in the written scope. This is a sample specification, not a past client deliverable.
Sources of uncertainty we report
- —Canopy and leaf overlap between neighboring plants and rows
- —Variable lighting, shadows, wind-moved leaves and residue
- —Crop species and growth stage (small or grass-like seedlings are harder)
- —Weeds or volunteer plants that look like crop at emergence
- —GSD actually achieved and image blur
- —Sample-to-field extrapolation: a zone estimate is not a whole-field census
03 — Planning
Arizona planning: heat, monsoon and airspace
- —Summer visits are planned for early morning; afternoon heat, dust and monsoon storms (roughly June–September) can force reschedules.
- —Irrigation schedules matter: wet fields change soil color and can skew RGB cover proxies, so we record irrigation timing for each visit.
- —Airspace around Phoenix-Mesa Gateway (IWA), Chandler Municipal (CHD) and Phoenix Sky Harbor (PHX) is checked before booking; some locations need authorization or can't be flown.
- —We need permission to launch from the property and notice of workers, equipment or livestock in the field.
- —Coverage is scheduled by request, not from a local office — confirm availability with your quote request.
04 — Quote & limits
Call for pricing and project information
Call for pricing and project information. Every project is scoped individually — nothing is binding until a written quote is accepted.
What this service does not include
- —RGB (visible light) camera only — no multispectral, NDVI, thermal or LiDAR sensing
- —No guaranteed count accuracy; estimates are reported with method and uncertainty
- —No agronomic, crop-insurance or yield opinions, and no treatment or variable-rate prescriptions
- —Not a professional agronomist or licensed crop adviser service
- —No licensed land survey, and no BVLOS or chemical-application flights
05 — FAQ
Questions we hear on these projects
+How many visits do I need for progression monitoring?
It depends on what you want to see. Three to five dated visits — for example at emergence, mid-vegetative and near canopy closure — is a common starting plan. We'll suggest dates once we know the crop and planting date.
+Can a color camera show water stress?
Only indirectly. RGB imagery shows visible symptoms like color change or thin canopy, which may have many causes. It does not measure plant water status the way thermal or multispectral sensors attempt to. We don't fly thermal or multispectral.
+Are the maps comparable from one visit to the next?
We fly the same plan at similar times and settings and log the conditions. Lighting, irrigation timing and wind still differ between days, so each comparison carries a note on how comparable the dates are.
+Do you have staff in Arizona?
We schedule East Valley work by request and don't operate a local Arizona office. Confirm your dates when you request a quote so we can check availability.